This is the first automatic area-proportional Euler diagram drawing tool that uses ellipses. It generates an exact diagram for most of the cases, and when it fails, the best diagram obtained through the hill climbing search is displayed, together with the inaccuracy values for each region. Formal evaluation demonstrates that in contrast to various methods that use either circle or polygons, accurate and intuitive Venn diagrams can be drawn for most random 3-set data using ellipses, which like circles are smooth and have good continuity. Other formal evaluation is being carried out to investigate how well it can handle data sets with regions whose area has to be zero. More work is being carried out to improve the design and features of future releases. Thus, any feedback is greatly appreciated. It is currently restricted to three curves, but later on, it will be extended to handle more curves. Please acknowledge eulerAPE whenever used (see the Licensing Terms and PLoS ONE paper).
 
eulerAPE for real data sets: Regenbrecht et al., BMC Med Genomics 2008 eulerAPE for real data sets: Lenz & Fornoni, BMC Medicine 2006 eulerAPE for real data sets: Mann & Mann, Proteome Science 2011
 

eulerAPE for real-world data: click on the image to view the diagram published in the journal article that discussed this real-world data


New improved version:   eulerAPE  v3
 
This page is dedicated to the latest version, eulerAPE v3. Previous versions are available at: v2, v1.
 
The drawing algorithm of eulerAPE v3 has been improved. Minor changes to the interface have been made.

 
As in eulerAPE v2,
  • diagrams can be exported in png and svg formats
    or in eld format to reveal the properties of the ellipses in the diagram,
  • black and white images of the generated diagrams can be produced,
  • region areas saved in a file (.els) or computed from a diagram in a file (.eld) can be loaded.
 
Also, eulerAPE v3 is:
  • locale-independent,
  • support command-line execution,
  • fully tested on both Windows and Mac OS X.
Share on Facebook
 
Share on LinkedIn
 
 
Share on Google+
 
Share via email
 
Printer friendly version
 
Drawing Area-Proportional Venn-3 Diagrams Using Ellipses (GHC & ACM SRC 2012)
The Pacific Northwest National Laboratory (PNNL) mentions eulerAPE on their Venn Diagram Plotter webpage, as an improved method for drawing area-proportional Venn diagrams with three curves.

eulerAPE featured in the New York Times magazine of April 15, 2013 to visualize the percentage of elderly with high blood pressure, heart disease, and/or Alzheimer's disease and other dementia.

Currently, eulerAPE is being used for various application areas, such as health, medicine, bioinformatics, proteomics, genomics, biophysics, life sciences, brain and mind sciences, statistics, marketing, classification and database queries.

eulerAPE v2 was selected for participation in the ACM Student Research Competition (SRC) at the 2012 Grace Hopper Celebration (poster to the left).
 

Contents

 
Downloads

file executable / source comments date
eulerAPE_3.0.0.jar executable the executable to run eulerAPE v3.0.0 on Windows or Mac OS X
(not tested on other operating systems)
Nov 18, 2013
eulerAPE_3.0.0_src.zip source the source code for eulerAPE v3.0.0 Nov 18, 2013
 
Ideal screen resolution: 1290 × 740 or better
 
NOTE: when you download any of these files, you are agreeing to eulerAPE's Licensing Terms
 
Getting Started

  1. Download and install Java version 6.0 or greater on your machine.
  2. Download eulerAPE_3.0.0.jar.
  3. Double click on the downloaded eulerAPE_3.0.0.jar to run eulerAPE.
 
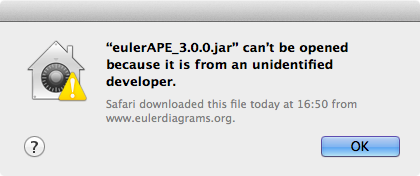
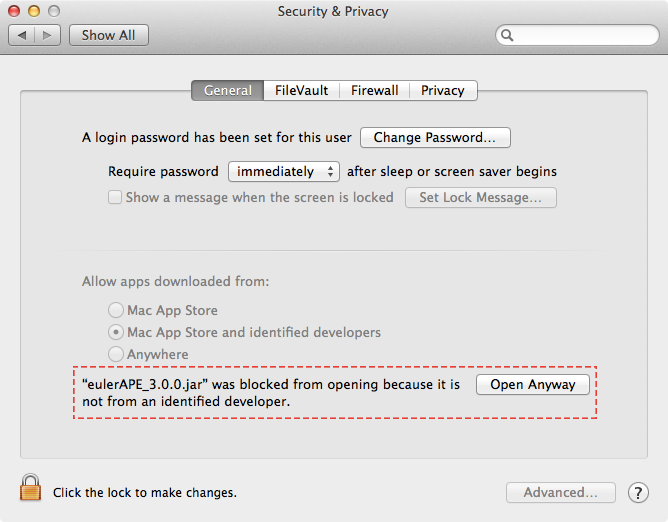
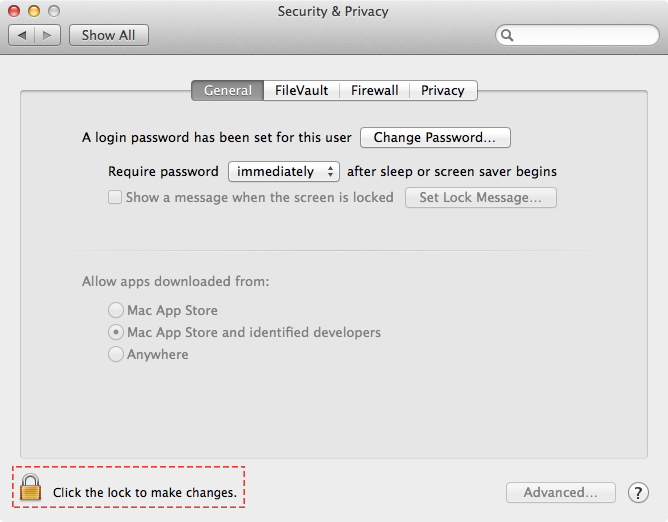
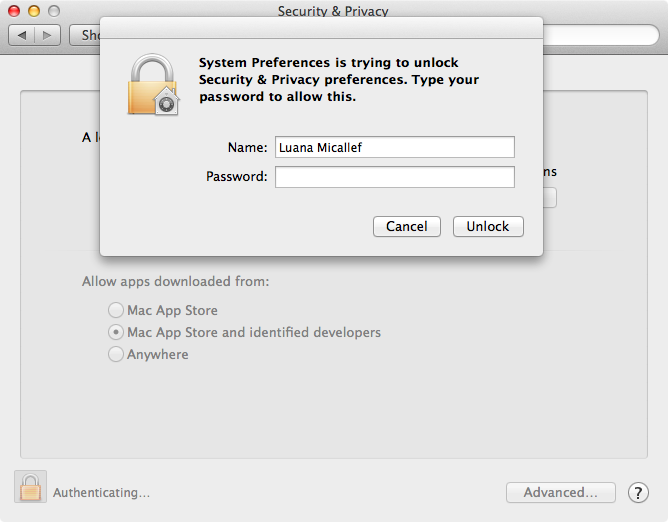
     Running on Mac OS X and getting the following message?


     Open System Preferences and go to Security & Preferences.
 
     If you get a message like the one in the red, dashed box below
 
 
click on Open Anyway and then click on Open when you get the following.
 
 
     Else, click on the lock in the bottom left corner, marked with a red, dashed box below
 
 
enter your Mac OS X account password
 
 
select Anywhere for Allow apps downloaded from and click on Allow From Anywhere when the warning message appears.
 
 
Finally click on the lock in the bottom left corner, close the Security & Preferences window, and try to run eulerAPE by double clicking on the downloaded eulerAPE_3.0.0.jar.
 
If you get the follow message box, click Open to run eulerAPE.
 
 
Running eulerAPE: in 3 steps
 
* the image below illustrates the interface when run on Windows


Running eulerAPE: reference guide
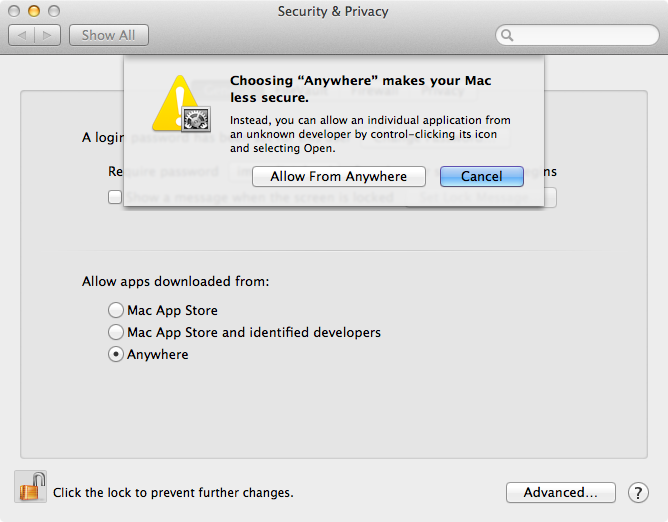
* the images below illustrate the interface when run on Windows and when the system locale is set to English
 
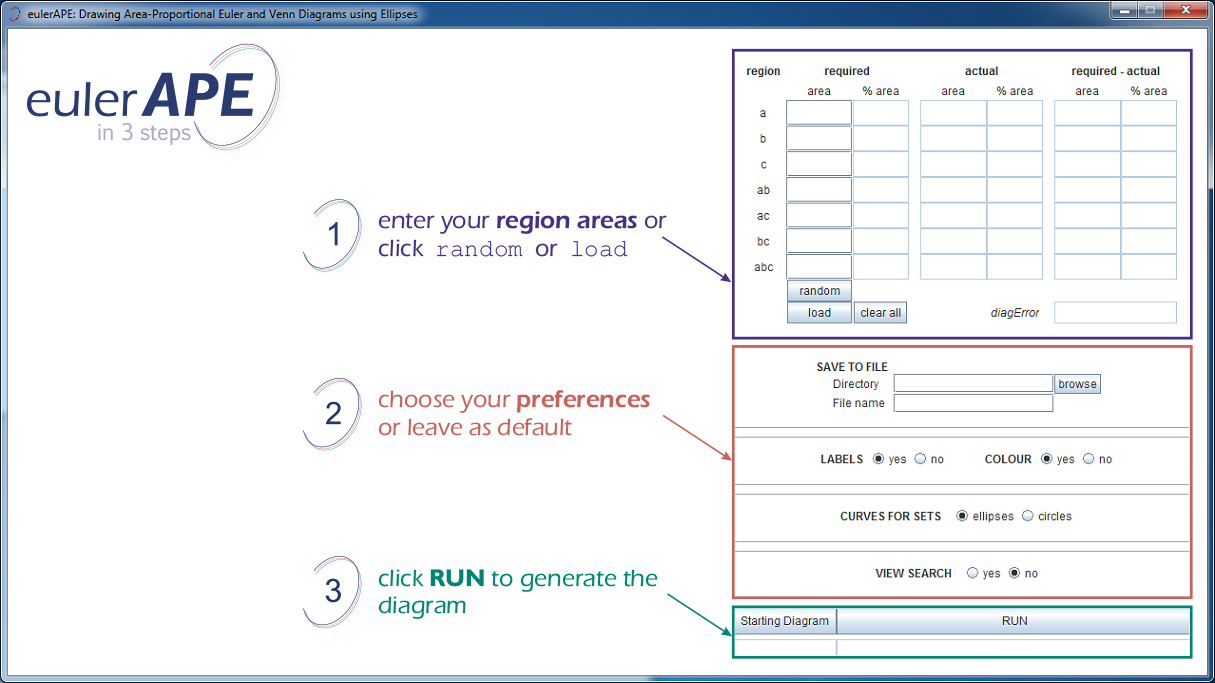
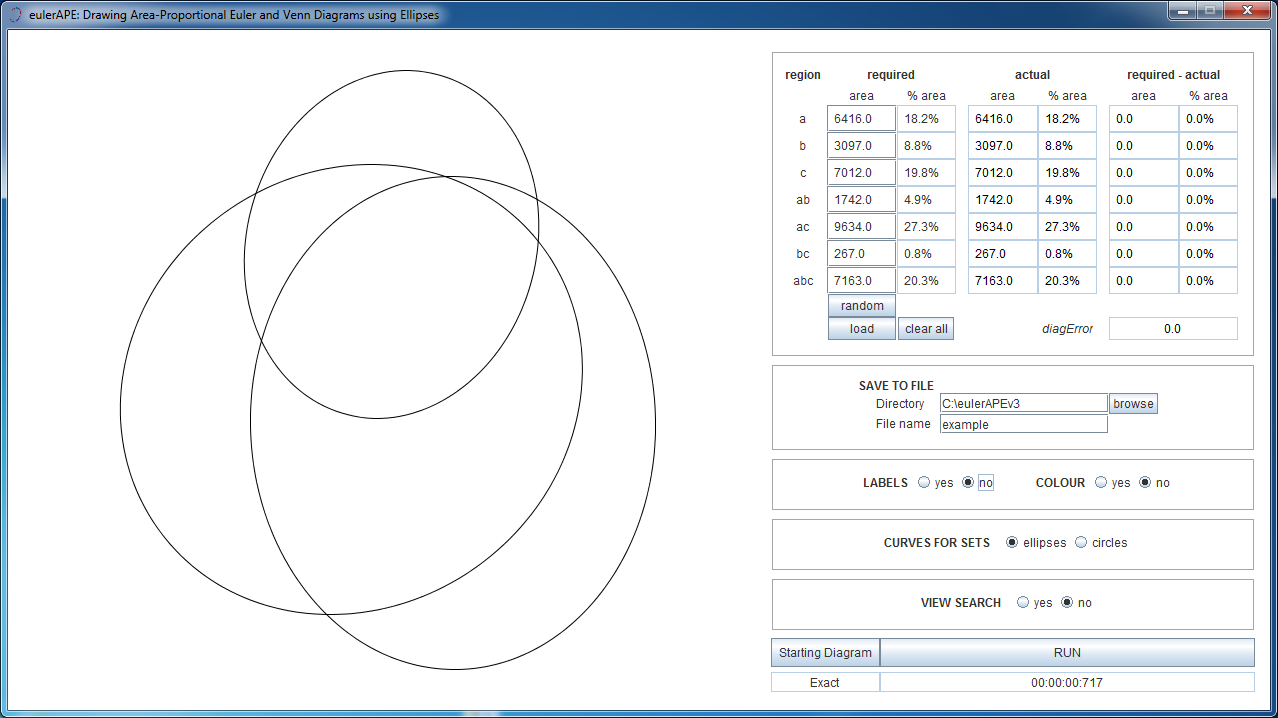
When eulerAPE starts, such a window opens:
 
 
To draw an area-proportional diagram, enter the area of every region or click on the random button to generate random region areas taken from a uniform distribution in the interval [1, 10000].
 
If an area of 0 is required for a region, replace 0 with a value that is small enough for its % area to be 0 with respect to the total area of the required diagram (e.g., replace 0 with a value that is close to 10-5 × total area of the required diagram).
 
 
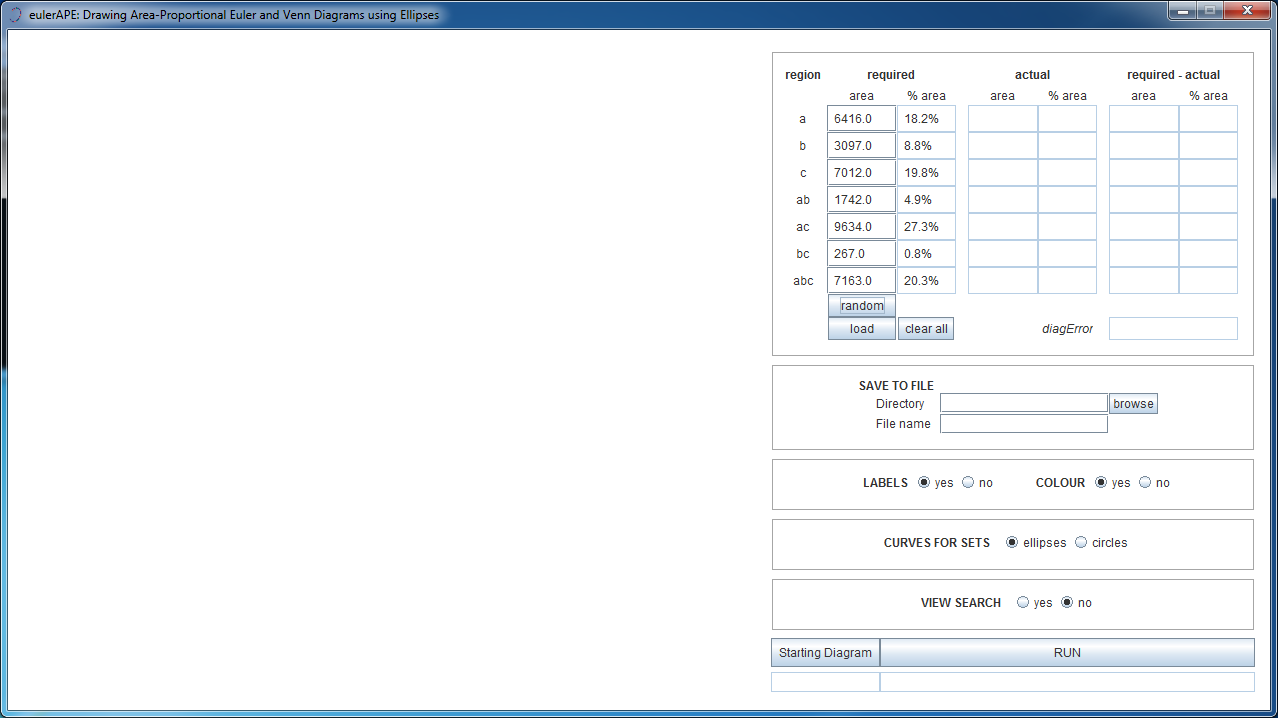
Alternatively, click on the load button and select a .els file ('eulerAPE region areas' file) or a .eld file ('eulerAPE diagram' file).
 
 
An eulerAPE region areas file with extension .els, such as this example (use a text editor to open or edit the file), defines the region areas to be loaded as follows:
 
 
   //a | b | c | ab | ac | bc | abc
   6416.46 | 3097.123 | 7012.0 | 1742.5 | 9634.67 | 267.0 | 7163.0
 
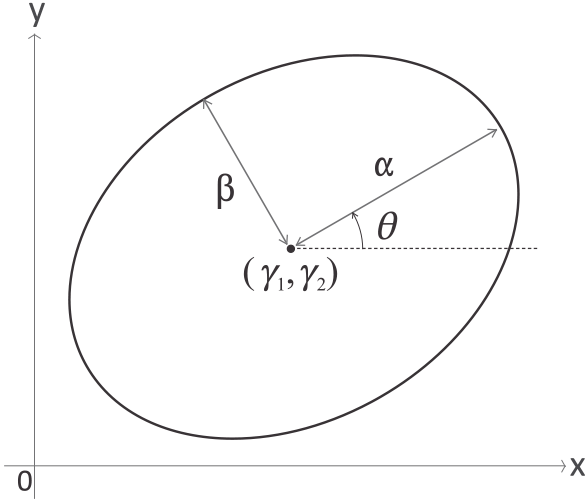
An eulerAPE diagram file with extension .eld, such as this example (use a text editor to open or edit the file), defines the properties of the ellipses in the diagram as follows:
 

   DIAGRAM

   ABSTRACTDESCRIPTION
   0 a b c ab ac bc abc

   ELLIPSES - label | semi-major axis | semi-minor axis | centre - x | centre - y | rotation |
   a|52.0770762121543|57.12818461089164|2.891387939453125|0.003662109375|307.1356201171875|
   b|42.17083337286026|34.68449741129755|12.592274634627673|34.713064198564346|74.014892578125|
   c|48.55774377211602|59.11052662064727|27.344059440869614|-8.125|0.9979248046875|
 
The label, the semi-major axis α, the semi-minor axis β, the x‑coordinate γ1 and y‑coordinate γ2 of the centre (γ1, γ2) on a Cartesian coordinate system, and the angle of rotation θ of the three ellipses must be defined (one line for each ellipse). The ellipses must be labelled as a, b, c.

If such a file is chosen, the region areas of the diagram in the file are computed and loaded. When eulerAPE diagram files are saved (as explained later), a .eld file is generated for both the initial and the final diagram in the search.
 
To view the inital diagram that eulerAPE uses to start off the search process, click on the Starting Diagram button.


Alternatively or consequently, start the search process by clicking on the RUN button. Before doing so:

  1. SAVE TO FILE:
    select the directory and the file name where images (in png and svg formats) and details of the initial and final diagram will be saved locally (if required), once the search is over and a diagram is generated
  2. LABELS: decide whether the shown and saved diagram should have labels
  3. COLOUR: decide whether the shown and saved diagram should be coloured or black and white
  4. CURVES FOR SETS: select 'ellipses' or 'circles' to draw the set curves
  5. VIEW SEARCH: decide whether you would like to view the search process or not
 
During the search, a timer (hours : mins : secs : msecs) is displayed in the bottom right corner of the window.

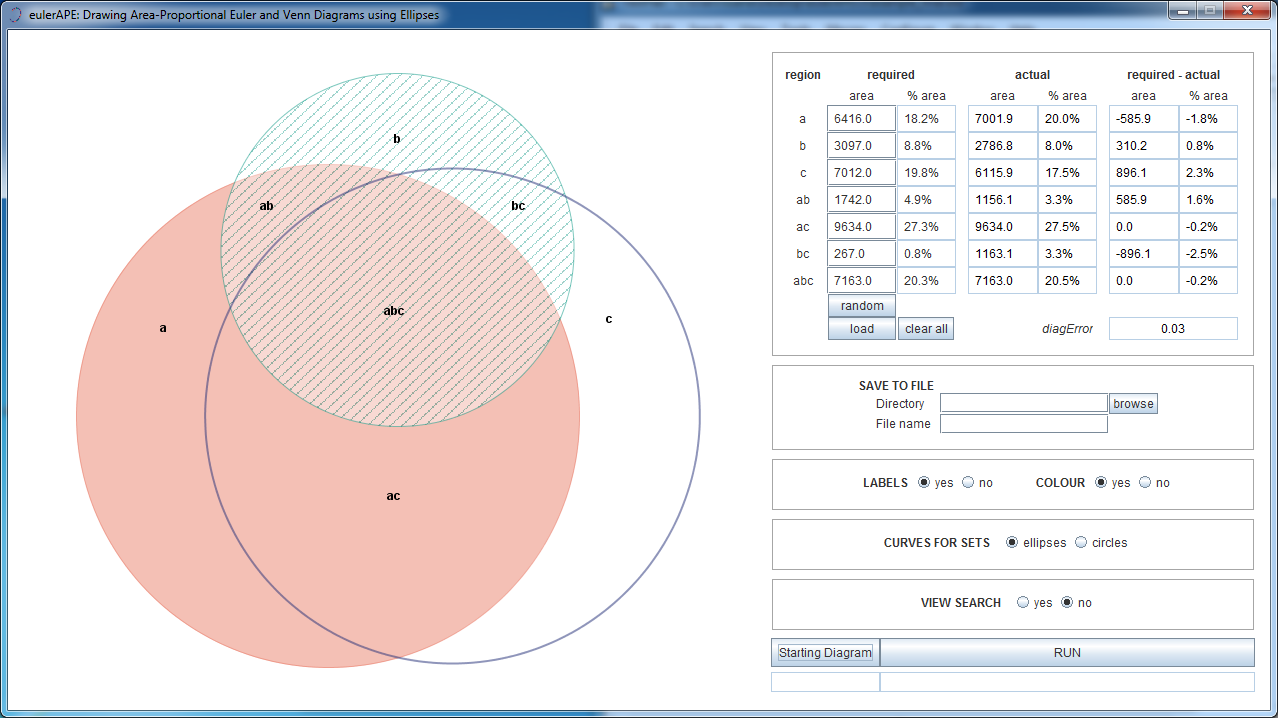
Once it stops running, a note saying Exact or Inexact is displayed just below the Starting Diagram button, to indicate whether an accurate or inaccurate diagram has been generated with respect to the required region areas.
 
 
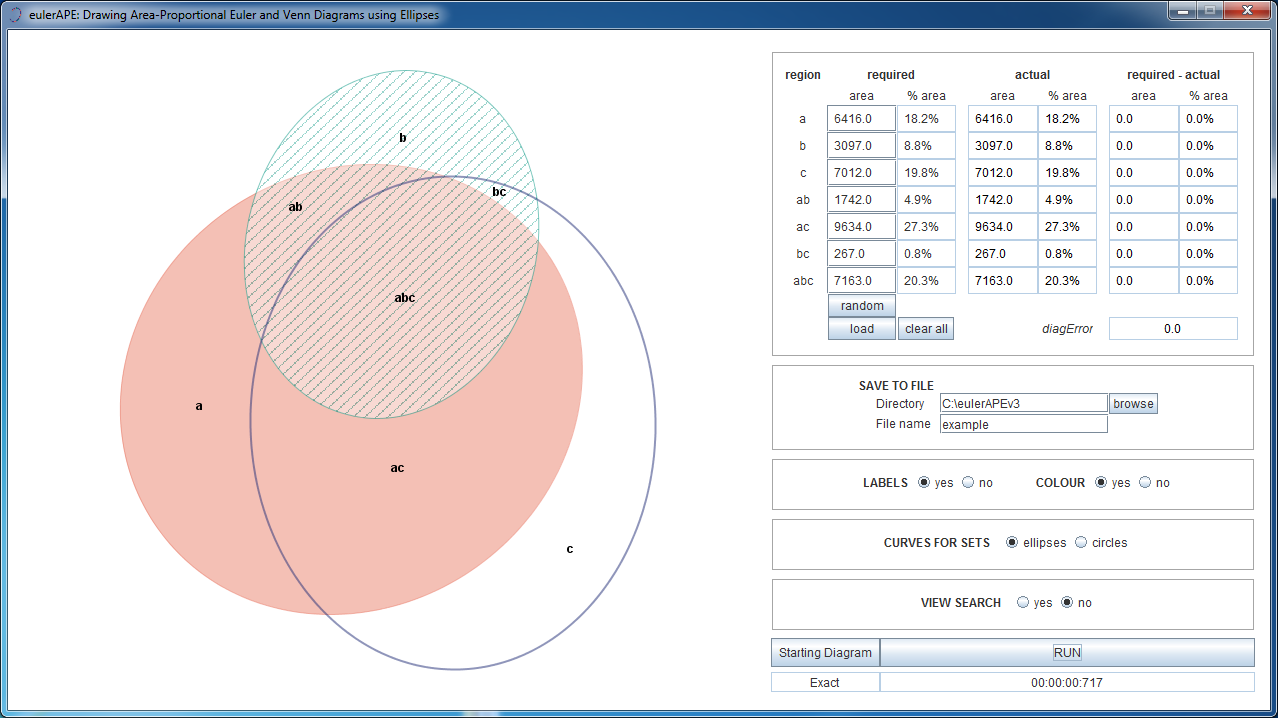
The accuracy of the generated diagram is measured by diagError, which is displayed below the table of the required and actual region areas.
 
If R is the set of regions in the diagram,
 
diagError = max_{}{r \in R} \left | \frac{\text{required area of region }r}{\text{total area of the required diagram}} - \frac{\text{actual area of region }r}{\text{total area of the actual diagram}} \right |
 
An accurate, Exact diagram with respect to the required region areas is one with diagError ≤ 10-6.
 
At any point, you can show or hide labels and switch between colour and black and white mode. The diagram is saved after the search is completed and thus, for the desired visuals to be saved locally, these options have to be set before clicking the RUN button.
 
 
To generate a diagram for a new set of region areas, click the clear all button and enter the areas manually, randomly or load them automatically from a file, as explained earlier.
 
Running eulerAPE: from the command-line
 
Open the command prompt and change the current working directory to the directory where eulerAPE_3.0.0.jar is saved.

Type in

   java -Duser.language=xx -Duser.region=XX -jar eulerAPE_3.0.0.jar

where

     - xx    is the ISO 639 alpha-2 (or ISO 639-1)   language code   (e.g.,  it  for Italian; codes available here)
     - XX    is the ISO 3166 alpha-2 (or ISO 3166-1)   country code   (e.g.,  IT  for Italy; codes available here)

followed by the required options

option parameter required default
-i  or  
--input
the path to a .els ('eulerAPE region areas') file, such as this example
(use a text editor to open or edit the file) defining the region areas for
which a diagram will be generated
yes -
-o  or  
--output
the path to the directory where the images (in png and svg formats)
and the .eld ('eulerAPE diagram') file, such as this example
(use a text editor to open the file) of the generated diagram will be saved
no current working directory
-l  or   
--showlabels
yes   or   no no yes
-c  or   
--showincolour     
yes   or   no no yes
--curves ellipses   or   circles no ellipses
-s   or   
--silent
- no -
 
Example:
 
   java -Duser.language=it -Duser.region=IT -jar eulerAPE_3.0.0.jar
        -i "C:\regionareas.els"  -o "C:\eulerAPEv3_diagrams"
        -l yes  -c yes  --curves ellipses  -s
 
Licensing Terms
 
Copyright logo  
Copyright © 2011-2013, Luana Micallef and Peter Rodgers. All rights reserved.
 
GNU GPLv3 logo  
eulerAPE is free and open source software: you can redistribute it and/or modify it under the terms of the GNU General Public License as published by the Free Software Foundation, either version 3 of the License, or (at your option) any later version.
 
eulerAPE is distributed in the hope that it will be useful, but WITHOUT ANY WARRANTY; without even the implied warranty of MERCHANTABILITY or FITNESS FOR A PARTICULAR PURPOSE. See the GNU General Public License for more details.
 
A copy of the GNU General Public License is provided with eulerAPE (in a file named 'COPYING'). Alternatively, see http://www.gnu.org/licenses/gpl.html.
 
Creative Commons License   All the material on this page (including, for instance, eulerAPE's logo and images) is licensed under a Creative Commons Attribution-ShareAlike 3.0 Unported License.
 
Please cite eulerAPE as follows
Luana Micallef and Peter Rodgers (2014). eulerAPE: Drawing Area-proportional 3-Venn Diagrams Using Ellipses.
PLoS ONE 9(7): e101717. doi:10.1371/journal.pone.0101717. http://www.eulerdiagrams.org/eulerAPE
whenever you use eulerAPE and whenever you reuse or adapt any of the material provided on this page.
 
Other Drawing Tools - you might be interested in
 
eulerForce The first method using a force-directed approach to automatically lay out Euler diagrams and to do so in relatively fast time.
http://www.eulerdiagrams.org/eulerForce
 
eulerGlyphs The first automatic diagram drawing tool that draws area-proportional Euler diagrams, glyph representations and hybrid visualizations combining both Euler diagrams and glyphs.
http://www.eulerdiagrams.org/eulerGlyphs


For any questions, please contact Luana Micallef or Peter Rodgers (emails).

School of Computing
University of Kent
Canterbury, UK
 
Copyright © 2011-2013, Luana Micallef and Peter Rodgers. All rights reserved.

Last updated: July 18, 2014