This is the first automatic area-proportional Euler diagram drawing tool that uses ellipses. It generates an exact diagram for most of the cases, and when it fails, the best diagram obtained through the hill climbing search is displayed, together with the inaccuracy values for each region. Formal evaluation demonstrates that in contrast to various methods that use either circle or polygons, accurate and intuitive Venn diagrams can be drawn for most random 3-set data using ellipses, which like circles are smooth and have good continuity. Other formal evaluation is being carried out to investigate how well it can handle data sets with zero region areas. The aim of the current software releases is to illustrate the effectiveness of the algorithm in drawing exact area-proportional diagrams. More work is being carried out to improve the design and features of future releases. Thus, any feedback is greatly appreciated. It is currently restricted to three curves, but later on, it will be extended to handle more curves. Please acknowledge eulerAPE when used.


eulerAPE for real data sets: Regenbrecht et al., BMC Med Genomics 2008 eulerAPE for real data sets: Lenz & Fornoni, BMC Medicine 2006 eulerAPE for real data sets: Bener et al., International Journal of Food Sciences and Nutrition 2011

eulerAPE for real world data: click on the image to view the original diagram published in the respective article


This page is dedicated to eulerAPE v2, following eulerAPE v1. The latest version is eulerAPE v3.
 
The drawing algorithm of eulerAPE v2 was an improvement on that of eulerAPE v1 and
included various additional features such as:
  • hiding labels,
  • producing black and white images,
  • exporting diagrams in png and svg formats,
  • loading region areas saved in a file or
    from a diagram described in a file.
Latest releases of eulerAPE v2 were also:
  • locale-independent,
  • support command-line execution,
  • fully tested on both Windows and Mac OS X.
Share on Facebook
 
Share on LinkedIn
 
 
Share on Google+
 
Share via email
 
Printer friendly version
 
Drawing Area-Proportional Venn-3 Diagrams Using Ellipses (GHC & ACM SRC 2012)
The Pacific Northwest National Laboratory (PNNL) mentions eulerAPE on their Venn Diagram Plotter webpage, as an improved method for drawing area-proportional Venn diagrams with three curves.

Currently, eulerAPE is being used for various application areas, such as health, medicine, bioinformatics, proteomics, genomics, biophysics, life sciences, brain and mind sciences, statistics, marketing, classification and database queries.

eulerAPE v2 was selected for participation in the ACM Student Research Competition (SRC) at the 2012 Grace Hopper Celebration (poster to the left).


Contents


Downloads

release comments date
2.0.3 fully tested on Windows and Mac OS X, locale-independent
supports command-line execution, exports diagrams in png and svg formats
Sep 6, 2012
2.0.2 fully tested on Windows and Mac OS X, locale-independent
no support for command-line execution, exports diagrams in png format only
Jul 30, 2012
2.0.1 fully tested on Windows and Mac OS X, only works for locales using a point as a decimal separator
no support for command-line execution, exports diagrams in png format only
Apr 13, 2012
2.0.0 does not work on Mac OS X, only works for locales using a point as a decimal separator
no support for command-line execution, exports diagrams in png format only
Jan 20, 2012
 
Ideal screen resolution: 1250 × 780 or better
 
Getting Started

  1. Download and install Java version 6.0 or greater on your machine.
  2. Download eulerAPE_2.0.3.jar.
  3. Double click on the downloaded eulerAPE_2.0.3.jar to run eulerAPE.
 
Running eulerAPE: in 3 steps


Running eulerAPE: reference guide

 
When eulerAPE starts, such a window opens:
 
 
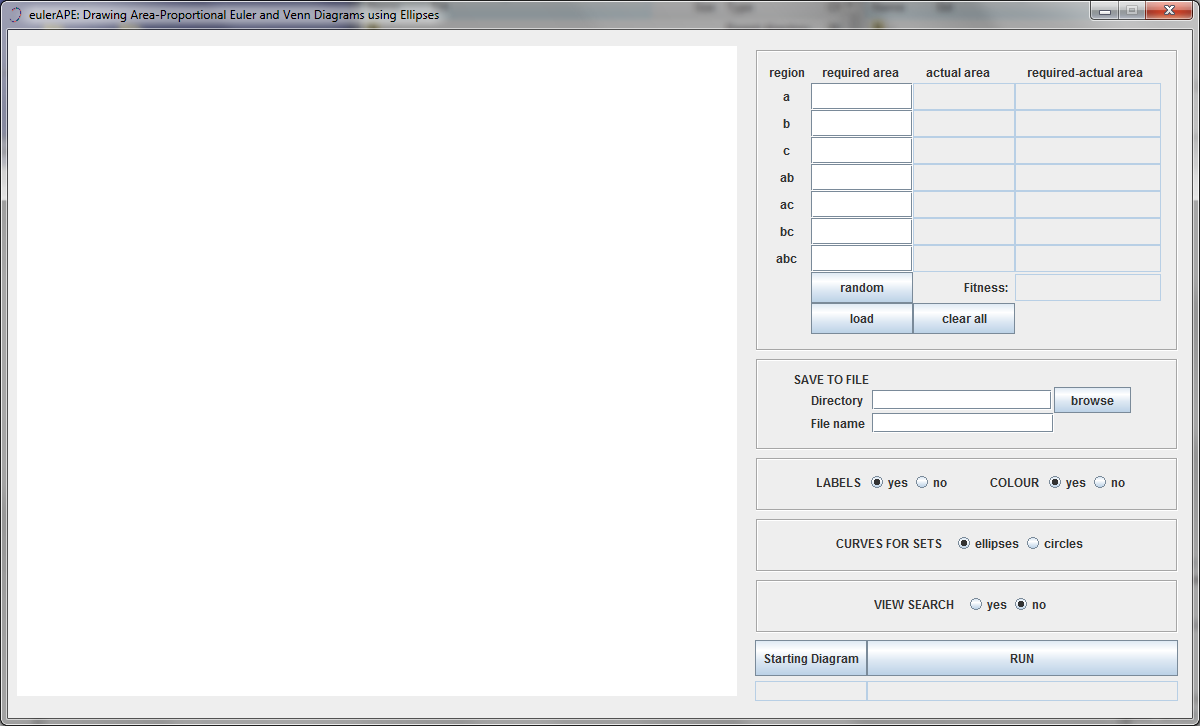
To draw an area-proportional diagram, enter the area of every region or click on the 'random' button to generate random region areas.
 
 
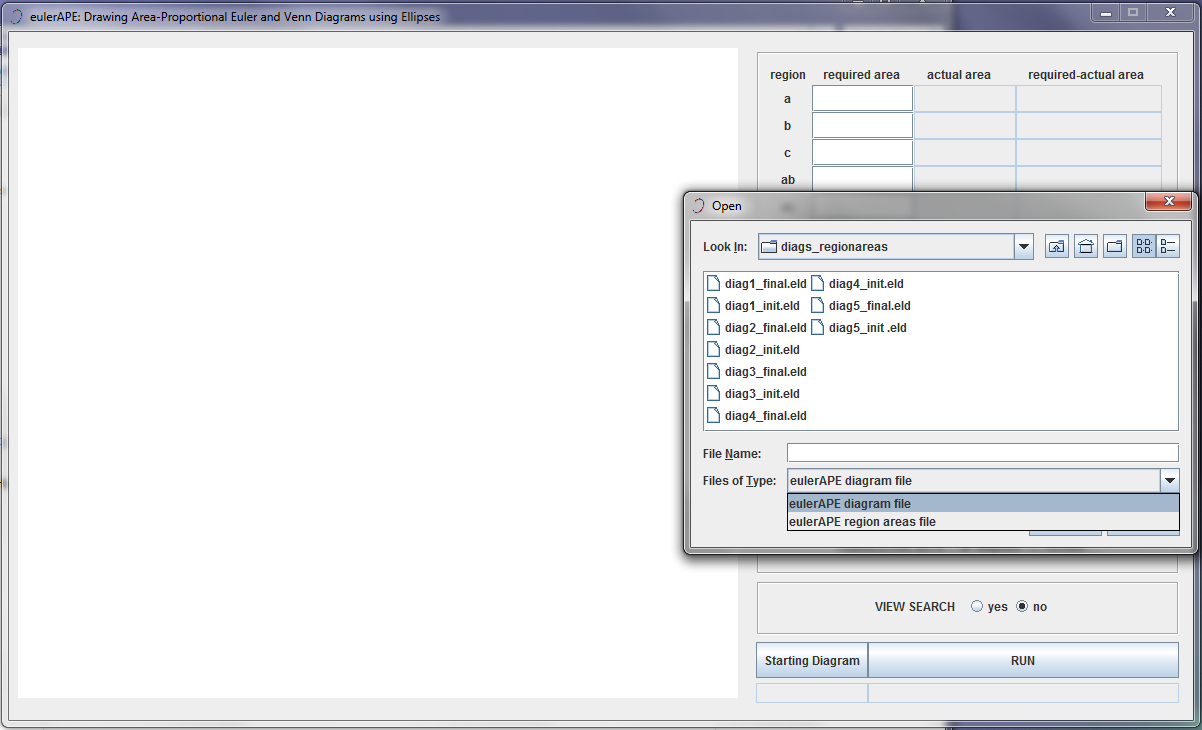
Alternatively, click on the 'load' button and select a .els file ('eulerAPE region areas' file) or a .eld file ('eulerAPE diagram' file).
 
 
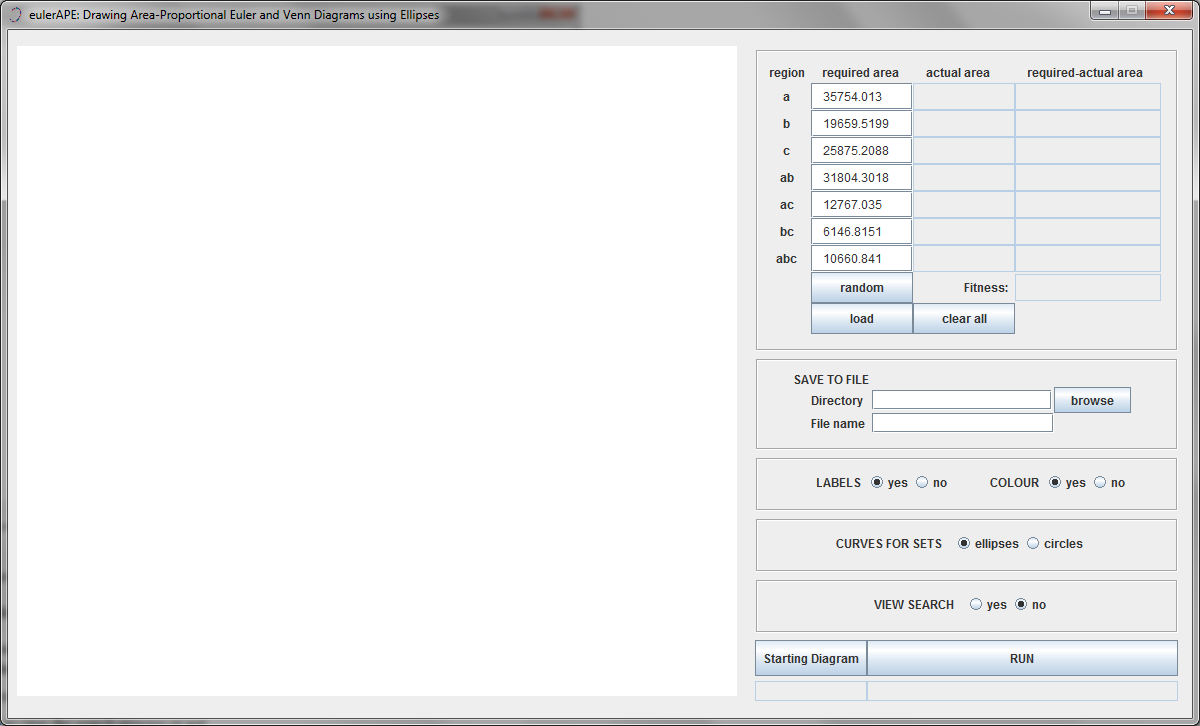
An 'eulerAPE region areas' file with extension .els, such as this example (use a text editor to open or edit the file), defines the region areas to be loaded as follows:
 

   //a | b | c | ab | ac | bc | abc
   35754.013 | 19659.5199 | 25875.2088 | 31804.3018 | 12767.035 | 6146.8151 | 10660.841
 
An 'eulerAPE diagram' file with extension .eld, such as this example (use a text editor to open or edit the file), defines the properties of the ellipses in the diagram as follows:
 

   DIAGRAM

   ABSTRACTDESCRIPTION
   0 a b c ab ac bc abc

   ELLIPSES - label | semi-major axis | semi-minor axis | centre - x | centre - y | rotation |
   a|153.5719137804447|188.5880803457693|13.73565673828125|15.873870849609375|28.0865478515625|
   b|134.13217642711342|162.01571769598812|127.37902934465217|-0.174407958984375|121.82968139648438|
   c|120.65623133360415|146.28532914593777|95.03880772271356|155.49038082122723|88.07373046875|
 
The label, semi-major axis α, semi-minor axis β, x of centre C, y of centre C, rotation θ of the 3 ellipses must be defined (one line for each ellipse). The ellipses must be labelled as a, b, c.

If such a file is chosen, the region areas of the diagram in the file are computed and loaded. When eulerAPE diagram files are saved (as explained below), a .eld file is generated for both the initial and the final diagram in the search.
 
To view the inital diagram that eulerAPE uses to start off the search process, click on the 'Starting Diagram' button.

Alternatively or consequently, start the search process by clicking on the 'RUN' button. Before doing so:

  1. SAVE TO FILE :
    select the directory and the file name where images (in png and svg formats) and details of the initial and final diagram will be saved locally (if required), once the search is over and a diagram is generated
  2. LABELS : decide whether the shown and saved diagram should have labels
  3. COLOUR : decide whether the shown and saved diagram should be coloured or black and white
  4. CURVES FOR SETS : select 'ellipses' or 'circles' to draw the set curves
  5. VIEW SEARCH : decide whether you would like to view the search process or not
 
 
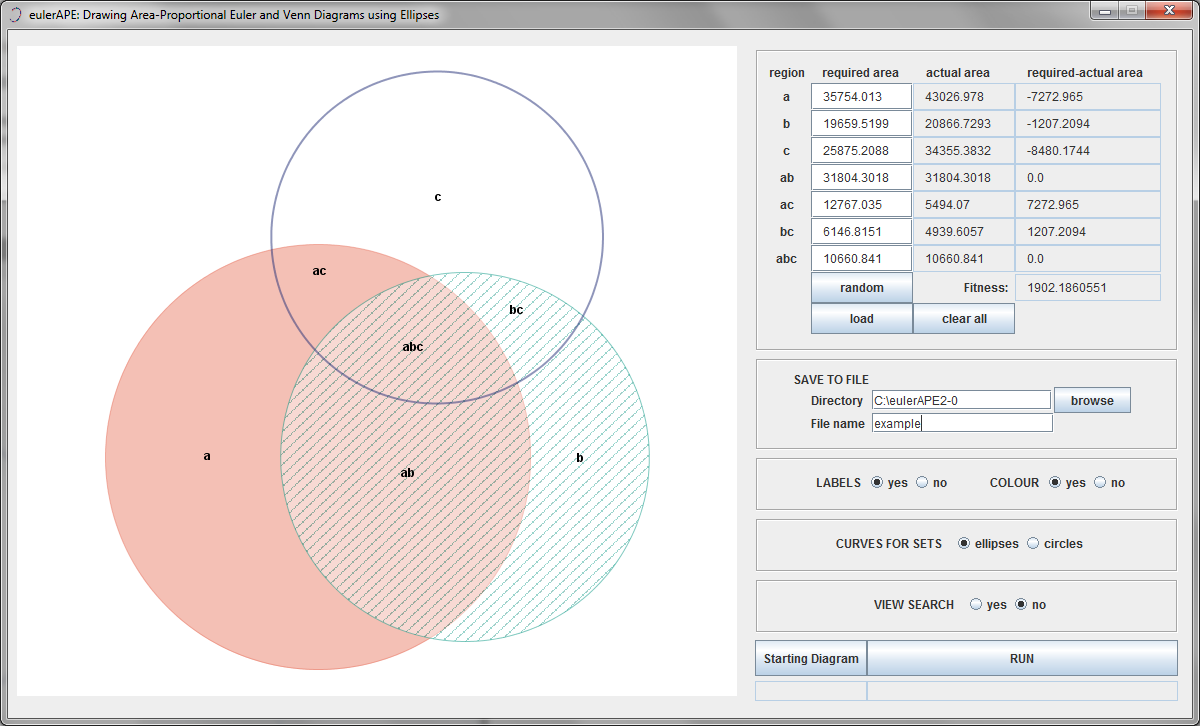
During the search, a timer (hours : mins : secs : msecs) is displayed at the bottom right corner of the window.

Once it stops running, a note saying 'Exact' or 'Inexact' is displayed just below the 'Starting Diagram' button,to indicate whether an exact diagram has been generated or not.
 
 
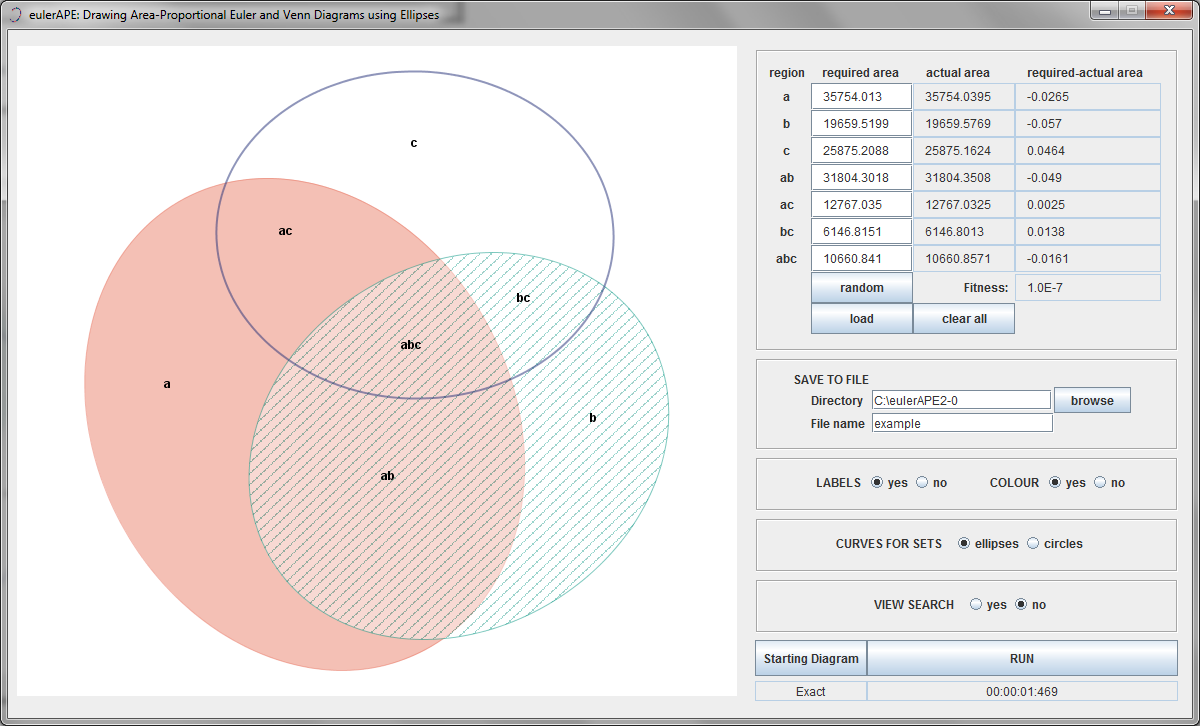
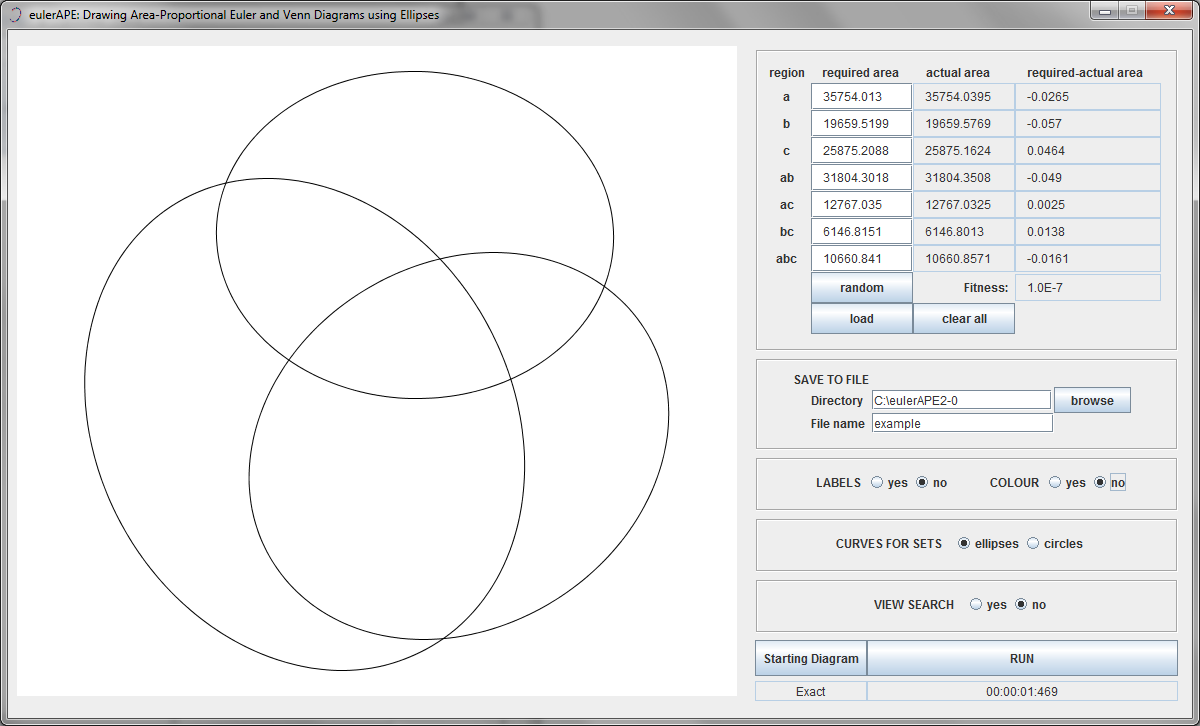
At any point, you can show or hide labels and switch between colour and black and white mode. The diagram is saved after the search is completed and thus, for the desired visuals to be saved locally, these options have to be set before clicking on the 'Run' button.
 
 
To generate a diagram for a new set of region areas, click on the 'clear all' button and enter the areas manually, randomly or load them automatically from a file, as explained earlier.
 
Running eulerAPE: from the command-line   (for eulerAPE v2.0.3 only)
 
Open the command prompt and change the current working directory to the directory where eulerAPE_2.0.3.jar is saved.

Type in

   java -Duser.language=xx -Duser.region=XX -jar eulerAPE_2.0.3.jar

where

     - xx    is the ISO 639 alpha-2 (or ISO 639-1)   language code   (e.g.,  it  for Italian; codes available here)
     - XX    is the ISO 3166 alpha-2 (or ISO 3166-1)   country code   (e.g.,  IT  for Italy; codes available here)

followed by the required options

option parameter required default
-i  or  
--input
the path to a .els ('eulerAPE region areas') file, such as this example
(use a text editor to open or edit the file) defining the region areas for
which a diagram will be generated
yes -
-o  or  
--output
the path to the directory where the images (in png and svg formats)
and the .eld ('eulerAPE diagram') file, such as this example
(use a text editor to open the file) of the generated diagram will be saved
no current working directory
-l  or   
--showlabels
yes   or   no no yes
-c  or   
--showincolour     
yes   or   no no yes
--curves ellipses   or   circles no ellipses
-s   or   
--silent
- no -


Example:

   java -Duser.language=it -Duser.region=IT -jar eulerAPE_2.0.3.jar
        -i "C:\regionareas.els"  -o "C:\eulerAPE2-0_diagrams"
        -l yes  -c yes  --curves ellipses  -s


Other Drawing Tools - you might be interested in
 
eulerForce The first method using a force-directed approach to automatically lay out Euler diagrams and to do so in relatively fast time.
http://www.eulerdiagrams.org/eulerForce
eulerGlyphs The first automatic diagram drawing tool that draws area-proportional Euler diagrams, glyph representations and hybrid visualizations combining both Euler diagrams and glyphs.
http://www.eulerdiagrams.org/eulerGlyphs


For any questions, please contact Luana Micallef or Peter Rodgers (emails).

School of Computing
University of Kent
Canterbury, UK
 
Copyright © 2011-2013, Luana Micallef and Peter Rodgers. All rights reserved.

Last updated: November 20, 2013